The Hot Summer Season begins with the ending of the humid Rainy Season in Japan. Extreme weather conditions this year significantly affect our daily lives.
As even slight temperature changes make differences in how we feel, we cannot ignore the impact of differences on the results of force measurements due to the changes in the ambient temperature.
Probably you have noticed that some of the samples become harder at lower temperatures? And with the higher temperature, the samples are more likely to break. To accurately determine if changes in the material properties due to temperature differences could affect the product quality, it is necessary to understand the differences in data by considering the ambient temperature during the force measurement.
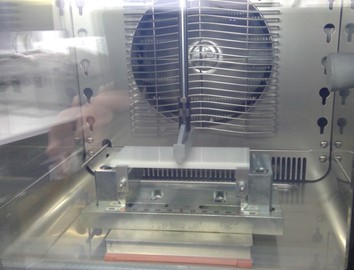
In this article, we use a measuring instrument equipped with a thermostatic chamber with temperatures adjusted between -40°C and 150°C to measure various samples, confirm the test result differences, and evaluate based on different temperatures.
We want to compare the different results!
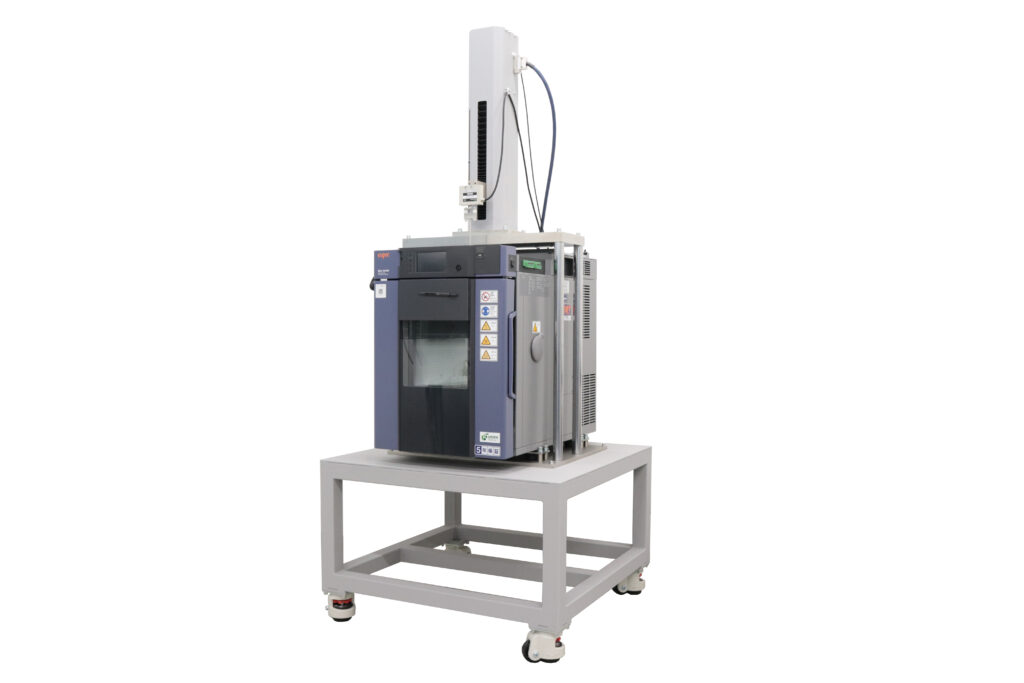
Table of Contents
(1) What are the Temperature Effects on Force Measurement?
(2) Verification of material properties change in different temperature environments – Adhesive Strength of Double-sided Tape
(3) Verification of material properties change in different temperature environments – Tensile Force of Rubber Band
(4) Verification of material properties change in different temperature environments – Resin Plate 3-point Bending Force
(5) Summary
(1) What are the Temperature Effects on Force Measurement?
Generally, temperature settings are specified in the test conditions for the force measurements. For example, it is possible to measure the difference in glue adhere strength at different temperatures or to observe the change in durability of the materials based on the actual operating environment.
Also, as in JIS (Japanese Industrial Standards) K7191-2:2015, “Plastics – Determination of temperature of deflection under load – Part 2: Plastics and ebonite,” temperatures are observed when samples are pressed at several different force values up to the specified depths.
The following examples explain the changes in properties of individual samples measured in IMADA’s lab at different temperatures.
(2) Verification of property change in different temperature environments – Adhesive Strength of Double-sided Tape
In the first case study, the adhesive strength of the double-sided paper adhesive tape is measured with the tack test: The double-coated adhesive tape, cut into 10 mm squares, is applied with a force of 50 N, and then the upper jig is lifted at a speed of 10 mm per minute.
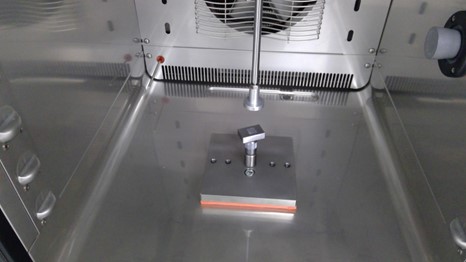
For the measurement, selected four temperatures at -10°C, 0°C, 20°C, and 50°C from the durable temperature range of the product, are set in the thermostatic chamber.
The results in the graph below, with the vertical axis representing the force value (i.e., adhesive strength) applied until the tape leaves the jig and the horizontal axis representing the distance of the jig pulled up to that point.
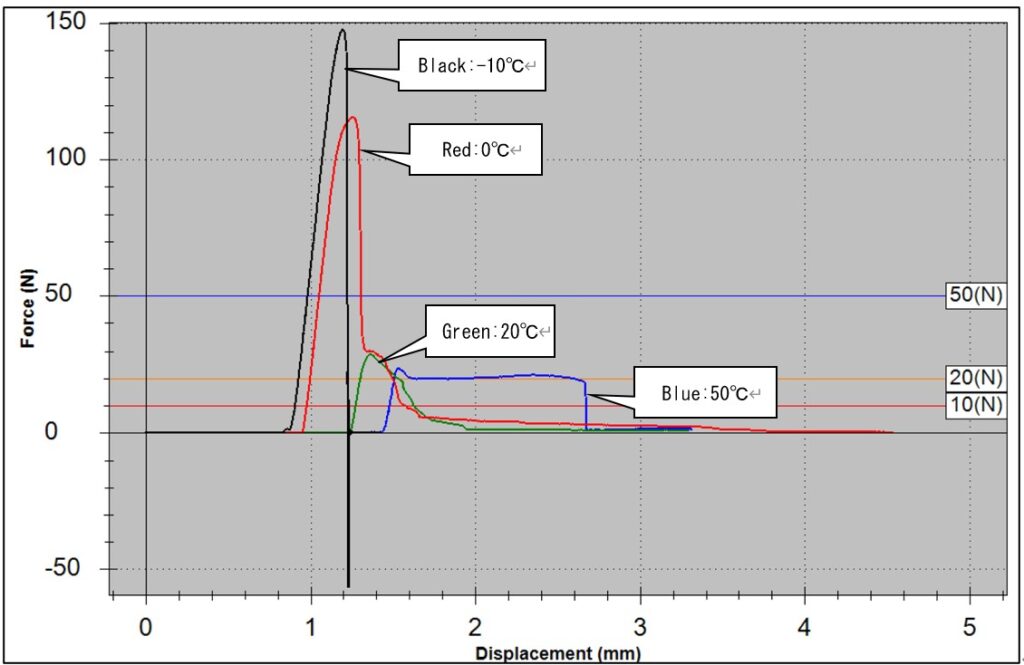
The graph specifies that temperature and adhere strength are inversely proportional. Also, it clearly shows especially by the blue graph that the longer time is required for the tape to separate from the jig completely as the temperature increase, reflecting the state of the tape’s adhesive.
(3) Verification of Material Properties Change in Different Temperature Environments – Tensile Force of Rubber Band
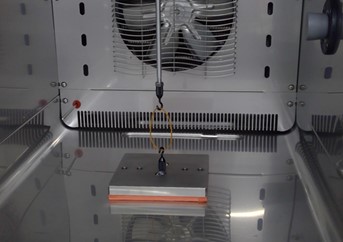
In this case study, the following example compares the tensile forces of the rubber bands: a 1.1 mm wide rubber band is hooked to a hook-shaped jig and pulled at 600 mm per minute until the force reaches 2N.
The amount of rubber elongation at 2N is compared at different temperatures.
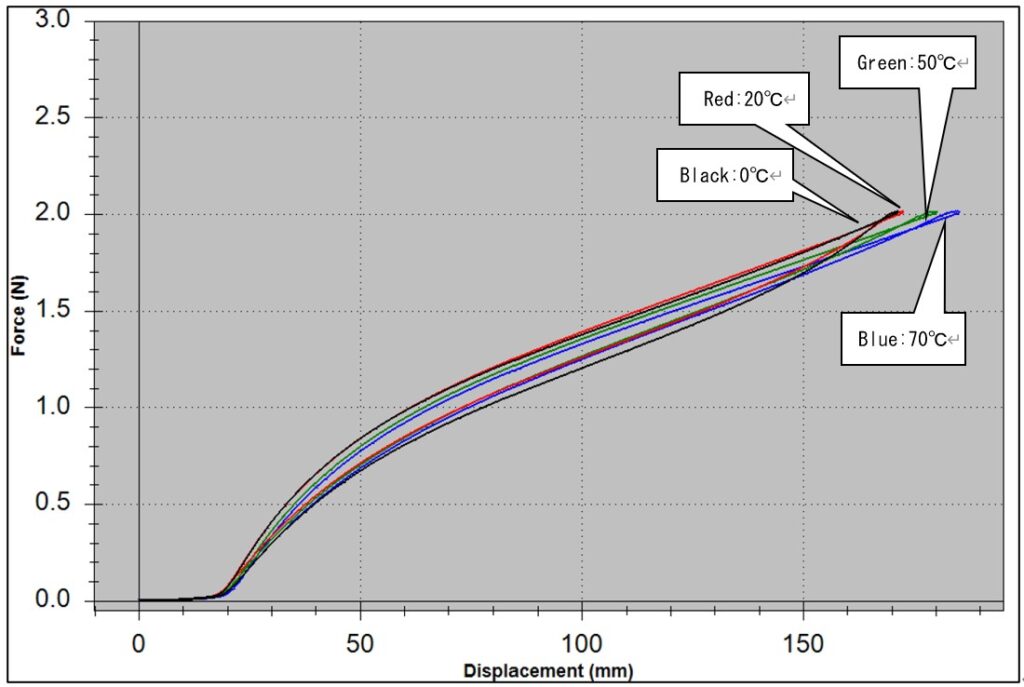
Since the endurance temperature of the sample rubber bands is -40°C to 70°C, a total of seven temperatures were measured, from 0°C, 20°C, 50°C, and 70°C at the top, and -10°C, -25°C, and -40°C at the bottom. In this case, since the sample rubber bands are always pulled until reaching 2N, the highest value on the vertical axis is common to all graphs, and the displacement value on the horizontal axis is the amount of elongation up to that point. The results are as follow:
(High-temperature Range)
(Low-temperature Range)
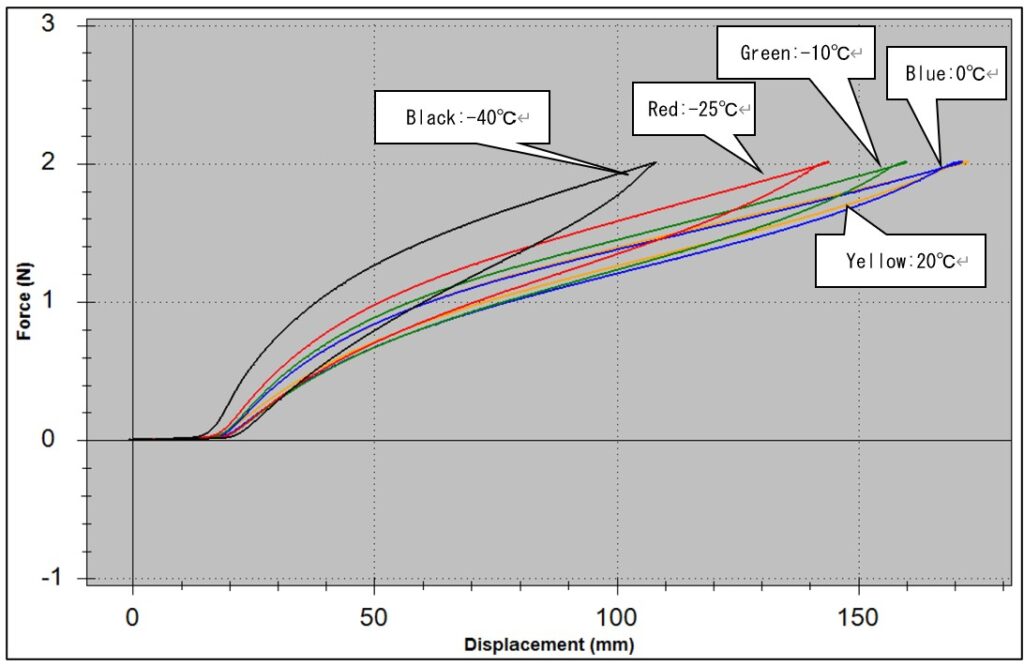
In the high-temperature zone, all records showed elongation of 150 mm or more, whereas, in the low-temperature zone, more elongation variations were observed when pulled at 2N. However, there is no significant difference in the amount of elongation, especially in the temperature range from -10°C to 50°C, which is the temperature range most often used in practice, suggesting that the practical quality of the product is excellent and stable for standard uses.
(4) Verification of material properties change in different temperature environments – Resin Plate 3-point Bending Force
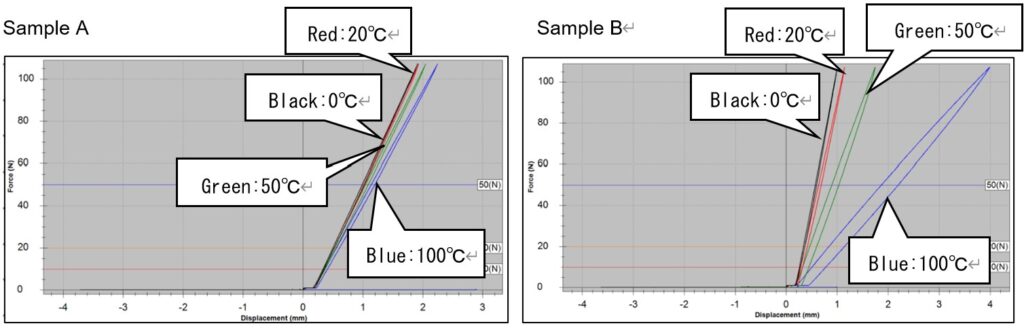
The last case study is a three-point bending test of two types (A and B) of resin plates. A resin plate with a width of 120 mm, depth of 50 mm, and thickness of 5 mm is pressed at 10 mm per minute until the applied force exceeds 100N and the deflection degree is compared.
Sample A has a durable temperature range of -100°C to 120°C, and Sample B has a durable temperature range of -40°C to 120°C.
The measurements proceeded at seven temperatures, including low-temperature zones of 40°C, -25°C and -10°C. As with the rubber band example, the force values on the vertical axis are slightly over 100N, and the displacement value on the horizontal axis can be used to determine the difference in deflection.
(High-temperature Range)
(Low-temperature Range)
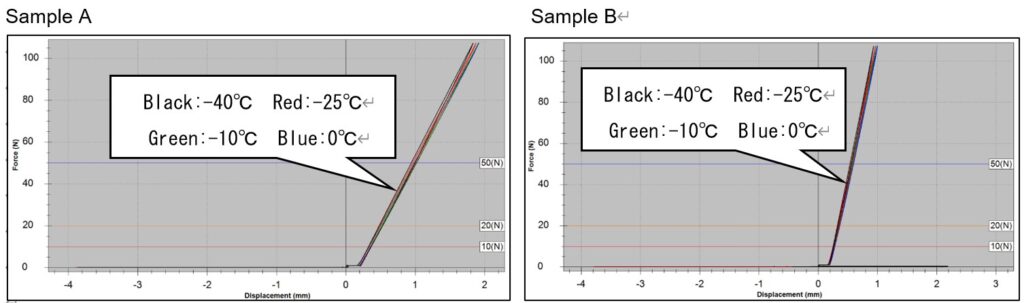
Unexpected results were indicated; in the low-temperature range, with differences in the durable temperature, found almost no differences in the amount of deflection shown between samples A and B, while the apparent variation in the amount of deflection in the high-temperature ranges, significant for both samples.
Sample A maintained relatively stable quality even at 100°C, which differs from the upper limit of the durable temperature. While the deflection of Sample B began to increase from about 50°C, and at 100°C, the deflection was nearly eight times that of at 0°C, indicating that the temperature significantly affected the material property.
(5) Summary
By using multiple samples for measurement, we were able to understand the effects of temperature on sample properties once again. As in the third case study, even seemingly similar samples were found to have had very different characteristics, and there was a temperature range where quality began to vary even within the service temperature depending on the material.
If you are interested in discovering more about the characteristics of the material properties of your samples in different temperature environments, the tests with the thermostatic chamber could be one of the solutions.
Do not hesitate to contact us for more details and choices of options.