Q: We are conducting tensile strength tests of materials for new products currently in development. From the previous article, we learned about the capacity and the accuracy, but what is the sampling rate mentioned in the specifications?
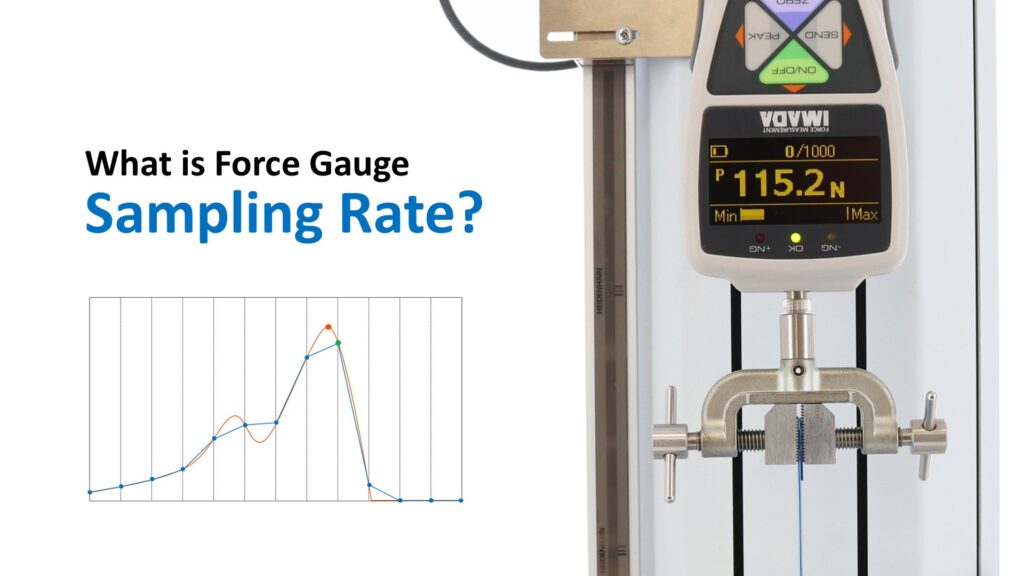
A: Sampling Rate is the performance value indicating how many times/second the force value data is acquired. Expressed in units such as 2000 times/second or 2000Hz (*times/second=Hz). Higher the sampling rate, higher accuracy break value is obtained, among other advantages.
Generally, digital force gauges convert the “analog signal (voltage) that changes according to the force value” obtained from the force sensor into a “digital signal (force value)” *1 to display and record the force value. While analog signals change continuously, digital signals change discontinuously.
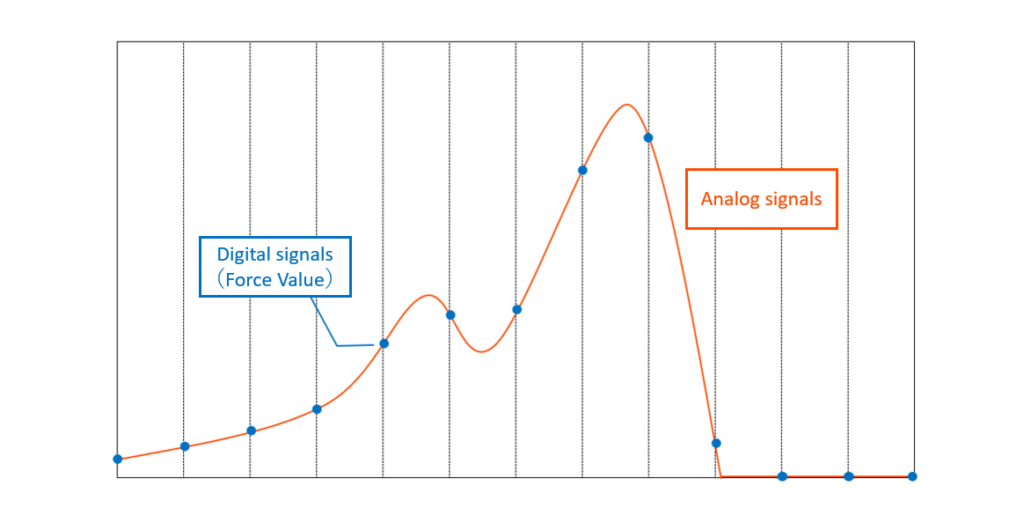
Therefore, depending on the timing of the conversion from analog signals to digital (AD conversion), there may be possibility that the maximum force value is ignored or failed to detect subtle force changes.
The sampling rate is the indication of number of AD conversions conducted per second.
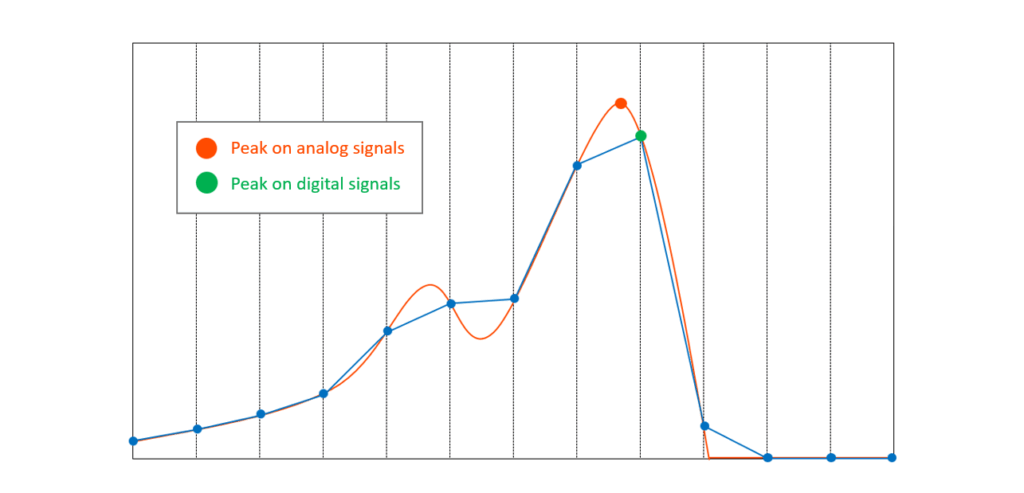
In the graph above, AD conversion performed before the peak value on the analog signal, causing a shift in the peak value between the analog and digital signals. Also, looking at the force transition when the digital signal connected, the increase and decrease in the force value identified just before the peak value are not captured.
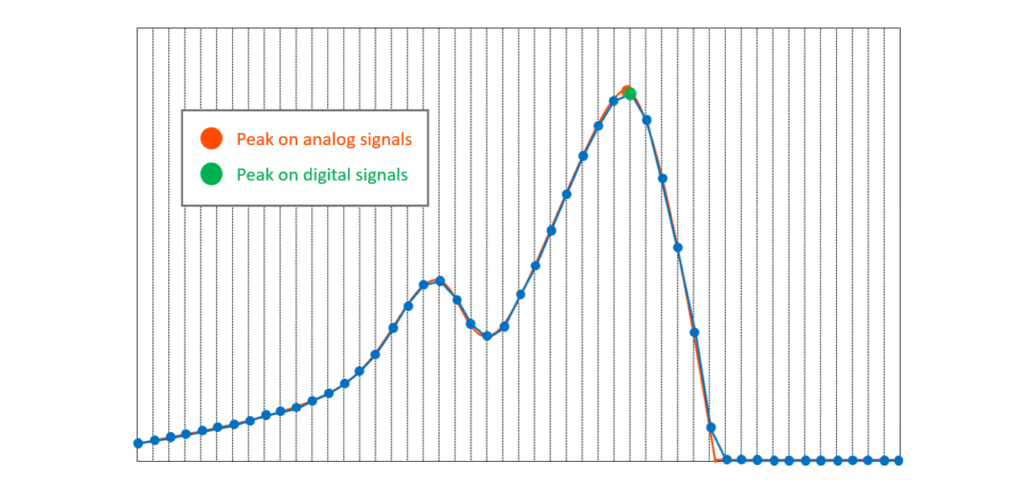
The above issue can be resolved by using a force gauge with a higher sampling rate. For example, if a force gauge with four times the sampling rate were used, the converted digital signal graph would be as follows.
So, what sampling rate is necessary for measuring the tensile strength of materials?
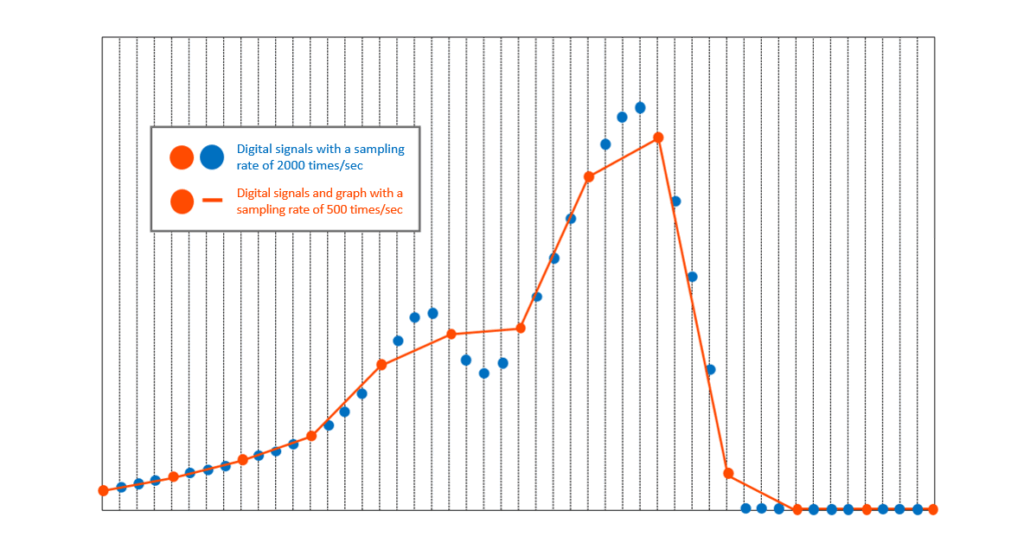
The graph below shows simulated results compiled from actual breakage test data, representing the force curves and peak values obtainable at each sampling rate.
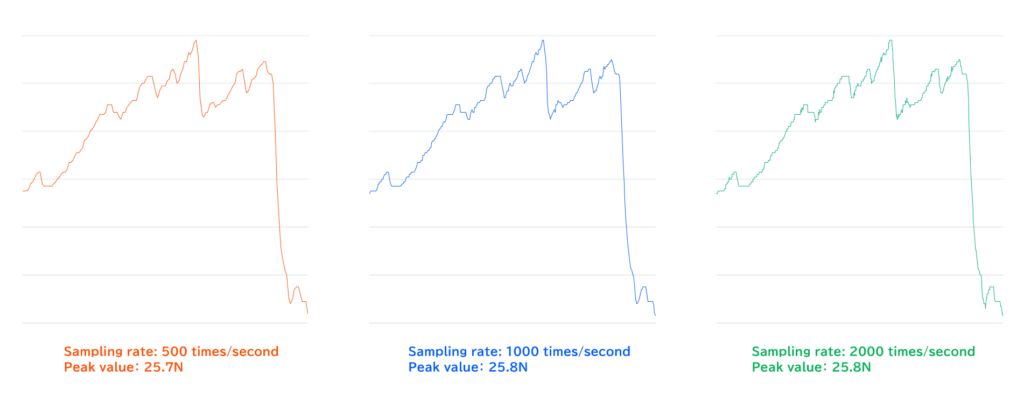
At a sampling rate of 500 times/second, the general force transition is captured, but the subtle changes are not captured as seen in 1000 times/second in comparison, and the peak value showing 0.1 N lower. On the other hand, at 1000 times/second, the same peak value was captured as at 2000 times/second, and it appears to have tracked subtle force changes.
Based on the results, the sampling rate of 1000 times/second or higher is recommended when conducting tensile strength tests on materials. However, when testing at high speeds, the force changes also become more rapid, meaning selecting a force gauge with a sampling rate of 2000 times/second may be advisable. Also sampling rates may be specified in standards, so verification of the requirements is advised.
Digital force gauges are incapable of recording all force value data converted to digital signals in their internal memory. In most cases, they lack continuous data memory function, and even if they have, the recording rate is set to a low speed. Therefore, separate graphing software is required to monitor force value trends. Regarding peak values, many feature the ability to display acquired peak values and store them in internal memory.
Using Graphing Software
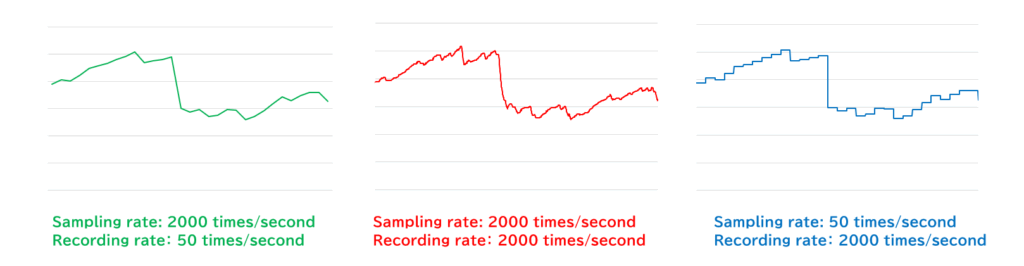
When using graphing software to record force value trends or check peak values, pay attention not only to the “sampling rate” but also to the “graphing software recording rate.” The recording rate is a performance value of the software indicating how many data points per second can be recorded.
If the force gauge has a sampling rate of 2000 times/second and if the recording rate of the software is only 500 times/second, only 25% of the force value data acquired via AD conversion is recorded, and graphed.
Consequently, similar to measurements taken with a force gauge having a sampling rate of 500 times/second, you may fail to accurately record peak values or miss subtle force changes.
It is not the case that it is better simply because it is higher. For accurate graphing that follows the actual force curve, both performance values must be balanced and high. This means it is crucial for the digital force gauge to acquire more force data and for the graphing software to record more of the acquired force data.
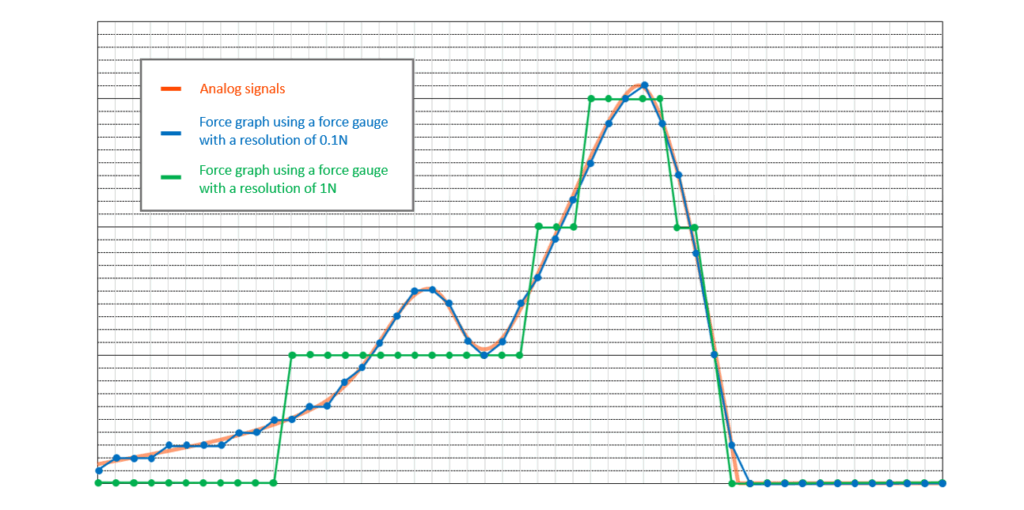
There are inquiries that users are unsatisfied with the graphs created being too rough, which is often due to the “resolution of the digital force gauge.” Resolution indicates the smallest unit of change in force value data that can be acquired. For example, if the resolution is 1N, the acquired force value data will change from 1N to 2N to 3N, whereas if the resolution is 0.1N, it will capture decimal changes from 1.0N to 1.1N to 1.2N… (There are also instruments available with resolution of 0.5N, such as 1.0N to 1.5N to 2.0N…).
If the resolution is too large compared to the amount of force changes, the force changes smaller than the resolution cannot be acquired, recorded, and graphed to accurately reflect the actual force changes. If this is an issue and the requirement is to observe minor force changes, necessary to select a force gauge with appropriate resolution based on the required force values.
In this article, we explained sampling rate and introduced the recording rate of graphing software with the impact of resolution on graphing. In actual practice, the sampling speed required varies depending on the conditions and the process such as the test speed, etc. of the measurement. At IMADA, support system is available to help with selecting a force gauge which meets your testing requirements. For more information, please contact us.
The graph below is a force-time graph of a plastic film break test, created with a sampling rate of 2000 times/second, a recording rate of 2000 times/second, and a resolution of 0.1N. Regarding the resolution in particular, it can be a challenging to select, as it also involves consideration of the capacity and other specifications. However, we hope you can use it as a reference when selecting force gauges and graphing software.

-1024x506.png)
*1 Some digital force gauges have function for outputting analog signals without converting them to digital signals. However, to record and graph the output analog signals on a digital device such as a PC, the signals must be converted into digital signals. For recording the transition of an analog signal without converting it to digital, the pen recorder can record the waveform on paper.